
linked-chart
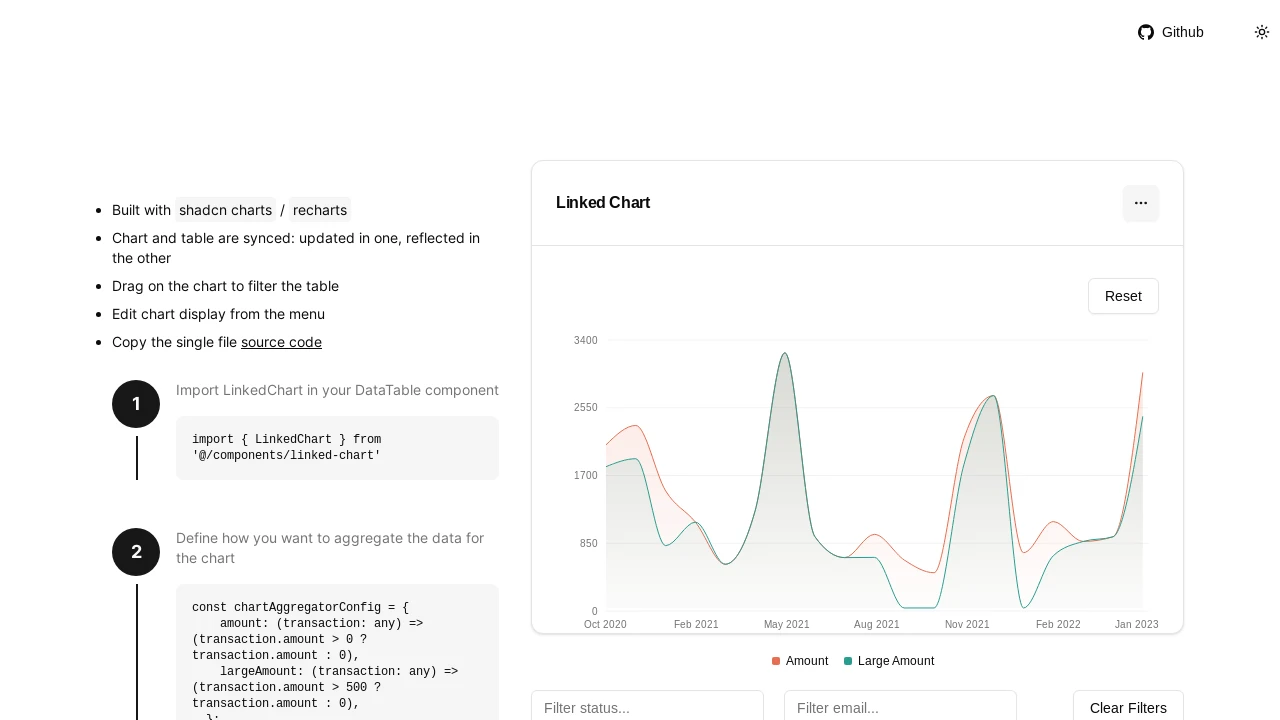
A React component for synchronized, interactive chart and DataTable views, built with shadcn charts/Recharts and Tanstack Table integration.
Dynamic Linked Chart & DataTable Component for React Applications
Enhance your React applications with this powerful component that seamlessly synchronizes interactive charts and data tables. Built using shadcn charts/Recharts and designed for integration with shadcn/Tanstack DataTables, it allows users to visualize and filter data dynamically. Interactive chart selections instantly update the corresponding table, providing an intuitive data exploration experience. It offers configurable chart types, date formatting, and custom data aggregation, making it a versatile solution for data-rich interfaces.
Features:
- Synchronized Views: Chart and table data are kept in sync, reflecting changes in one component in the other.
- Interactive Filtering: Selecting or dragging on the chart filters the connected DataTable based on the date range.
- Configurable Chart Types: Supports different chart visualizations such as Area and Bar charts.
- Multiple Date Format Options: Allows data aggregation and display by various date granularities like Month, Quarter, and Year.
- Custom Data Aggregation: Define custom functions via an
aggregatorConfigobject to process and summarize data for chart representation. - Standalone Chart Capability: Can be utilized as an independent chart component without being linked to a DataTable.
- shadcn/ui & Recharts Based: Leverages shadcn charts (which utilizes Recharts) for modern UI and charting capabilities.
- Tanstack Table Integration: Designed to work smoothly with DataTable components built using Tanstack Table, such as those from shadcn/ui.
- Single File Integration: Easily add the component to your project by copying the
LinkedChart.tsxsource file.
Summary:
This React component offers developers a ready-to-use solution for creating interfaces with linked charts and data tables. It streamlines the development of interactive data visualizations where chart interactions directly influence table displays. Featuring configurable chart types, flexible date aggregation, and straightforward integration, it aids in presenting complex datasets in an accessible, user-friendly manner, thereby enhancing data analysis capabilities within web applications.

Similar to linked-chart:
 SERP BLOCKS
