
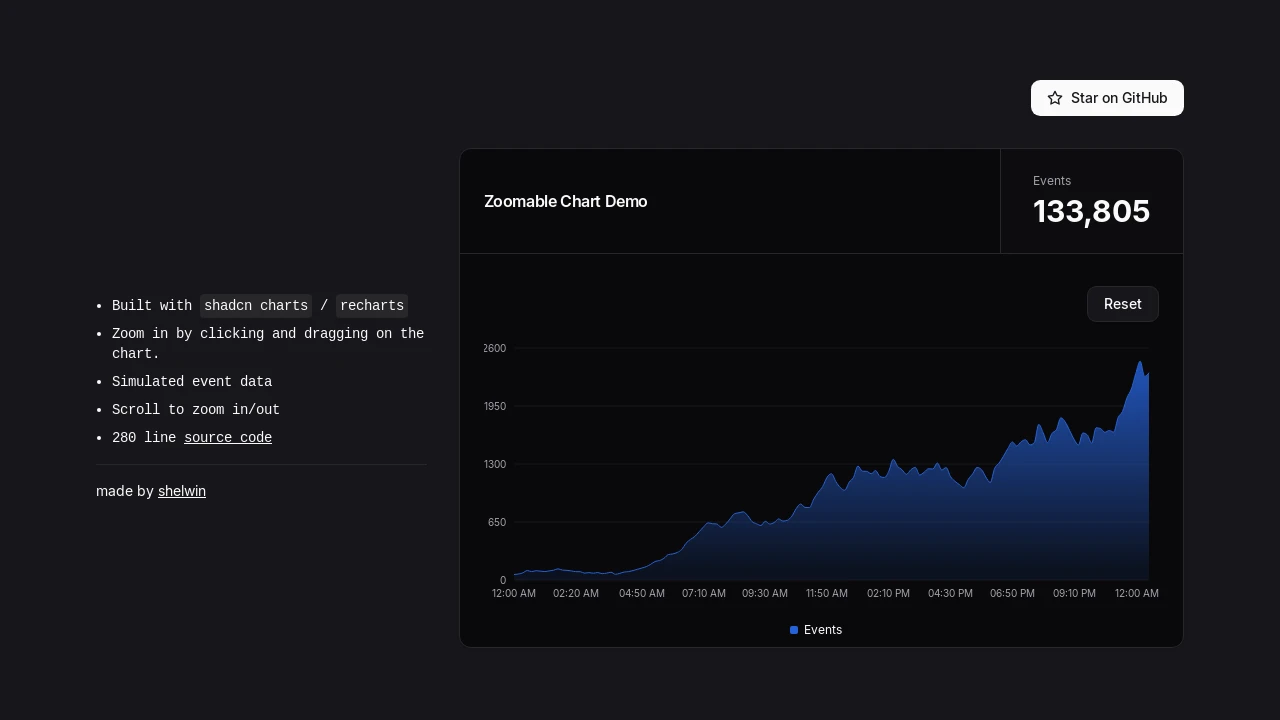
Zoom Chart Demo
A demonstration of a zoomable chart component using Shadcn UI and Recharts, featuring click-and-drag or scroll zooming.
Interactive Zoomable Charts with Shadcn UI and Recharts
This project demonstrates how to create a simple yet powerful zoomable chart using the popular Shadcn UI and Recharts libraries. It provides developers with a clear example of implementing interactive zoom functionalities, such as click-and-drag selection and scroll wheel zooming, to enhance data visualization. The core logic is neatly encapsulated within the components/chart.tsx file, making it easy to understand and adapt for your own projects showcasing event data or similar datasets.
Features:
- Click-and-Drag Zoom: Allows users to select a specific area on the chart by clicking and dragging, thereby zooming into that region for detailed analysis.
- Scroll Wheel Zoom: Enables intuitive zooming in and out of the chart view using the mouse scroll wheel for quick magnification adjustments.
- Shadcn UI Integration: Built with components from Shadcn UI, ensuring a modern and consistent look and feel.
- Recharts Powered: Utilizes the Recharts library for robust and flexible chart rendering and customization.
- Simulated Data Display: Demonstrates functionality with a sample dataset of events, providing a practical context for developers.
- Component-Based Implementation: The zoomable chart logic is contained within a dedicated React component (
chart.tsx) for easy integration and reusability.
Summary:
This zoomable chart demo serves as an excellent starting point for developers looking to add interactive data exploration features to their applications. By leveraging Shadcn UI and Recharts, it offers a practical guide on implementing click-and-drag and scroll-based zoom. The provided source code in components/chart.tsx allows for straightforward adaptation, empowering developers to build more engaging and user-friendly chart visualizations for presenting complex datasets effectively.
Similar to Zoom Chart Demo:
 SERP BLOCKS