
Shadcn Chart Brush
An example showcasing zoomable, brush-enabled charts built with ShadCN Charts and Recharts, offering enhanced data interaction for developers.
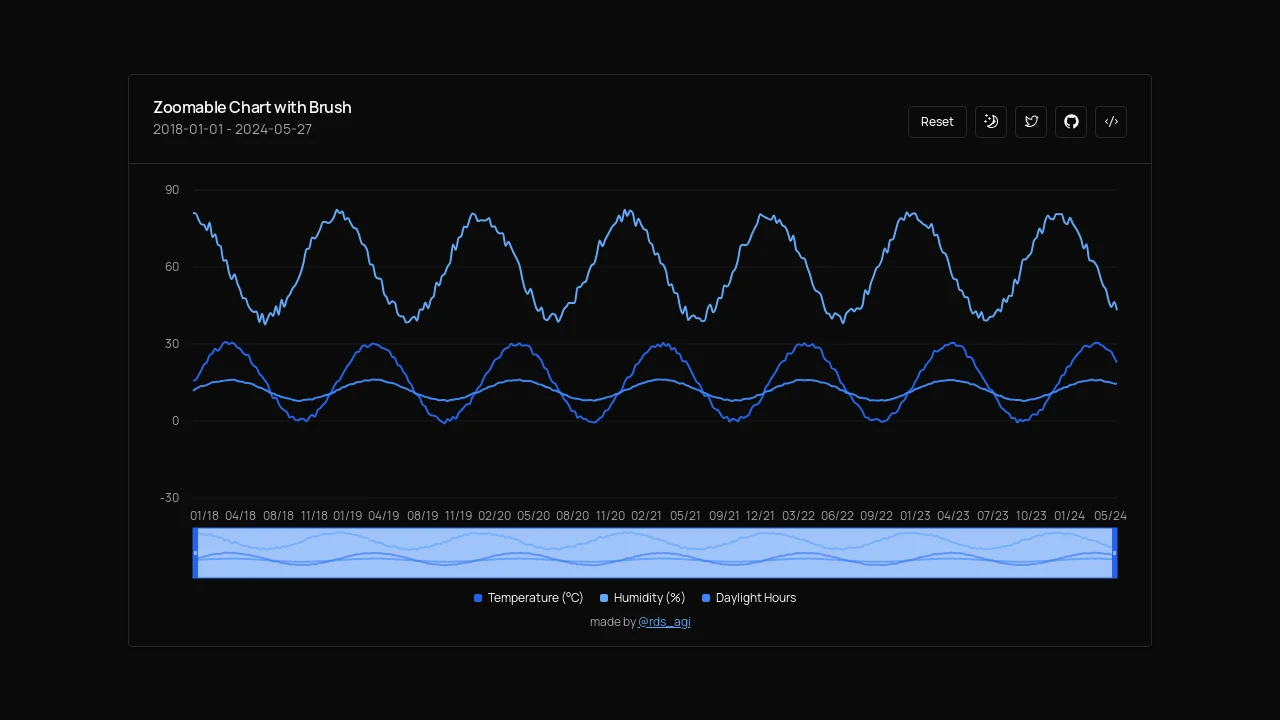
Dynamic Zoomable Charts: A ShadCN & Recharts Implementation
Explore an implementation of dynamic, zoomable charts featuring an intuitive brush tool, constructed with shadcn charts and the Recharts library. This example serves as a guide for developers aiming to incorporate advanced data visualization and interaction within their web applications. It demonstrates how to enable features like precise click-and-drag zooming, convenient scroll-based zoom adjustments, and versatile brush-controlled panning and zooming, fostering a superior user experience for detailed data exploration.
Features:
- Click-and-Drag Zoom: Users can magnify specific chart sections by selecting an area via mouse drag.
- Scroll-to-Zoom: Enables intuitive zooming in and out of the chart view using the mouse scroll wheel.
- Interactive Brush Tool: Offers a brush component for granular zoom control and smooth panning across data series.
- Zoom Reset Functionality: A dedicated 'Reset' button allows users to quickly revert to the chart's default zoom state.
- Theme Switching: Includes a toggle to switch between light and dark visual themes for user comfort.
- ShadCN Charts Integration: Utilizes shadcn charts for a modern aesthetic and component structure.
- Recharts Powered: Built upon the robust Recharts library for comprehensive charting functionalities.
Summary:
This project provides a clear demonstration of creating interactive zoomable charts with a brush, using the combined power of shadcn charts and Recharts. It guides developers in implementing key interactive elements like drag-to-zoom, scroll zoom, and brush navigation. With an included theme toggle and zoom reset, it's a practical example for enriching applications with sophisticated data visualization capabilities.

Similar to Shadcn Chart Brush:
 SERP BLOCKS